Treasure Data CDP Resources

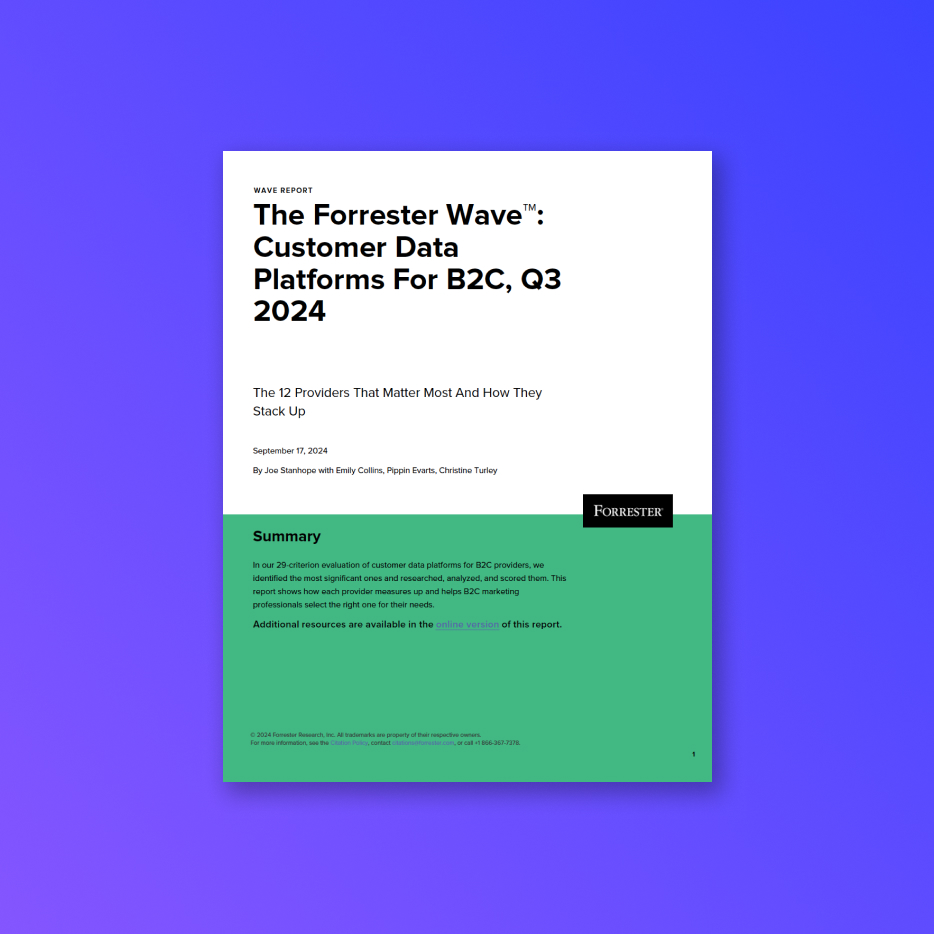
Treasure Data Named a Leader by Forrester
Get complimentary access to The Forrester Wave™: Customer Data Platforms For B2C, Q3 2024. Treasure Data was named a Leader by Forrester.
- Filter by Resource Type
- Analyst Reports
- Articles
- Blog
- Case Studies
- Cheatsheets
- Events
- Reports
- Sales Sheets
- Webinars
- Filter by Industry
- Automotive
- CPG
- Entertainment & Media
- Financial Services
- Healthcare
- Retail
- Technology
- Travel & Hospitality
- Filter by Topic
- AI & Machine Learning
- CDP
- CDP Use Cases
- Company News
- Customer Data Strategy
- Customer Service
- Data Privacy & Security
- Marketing
- Partners
- Treasure Data CDP
Global Travel Company Powers Unforgettable Experiences with 360° Data Views
With the help of Treasure Dataʼs Customer Data Platform (CDP) powered by AWS, this travel leader centralized fragmented data into a single source of truth.
Treasure Data MCP Server: Let Your LLM Talk to Your Data
This new open-source tool connects LLM assistants like OpenAI, Claude, and GitHub Copilot Chat directly to your Treasure Data environment.
AI Agent Foundry
Accelerate CDP value with AI Agent Foundry: secure, scalable AI agents powered by trusted data to boost targeting, productivity, and efficiency.
Treasure Data Bundled AI Suites
Leverage a customer data platform with AI agents embedded in every suite, choose from five AI bundled solutions to achieve your business goals.
Live Connect
Our enterprise zero-copy solution, access your data warehouse from Treasure Data CDP using its native integrations.
Treasure Data CDP Proof of Concept
Treasure Data offers a risk-free way to evaluate our CDP in your own environment. Test Drive the Treasure Data CDP with a Proof of Concept.
Treasure Data Journey Orchestration
Treasure Data Journey Orchestration helps marketers create seamless, personalized customer journeys across multiple channels and business units.
Treasure Data, the Intelligent Customer Data Platform
By integrating AI throughout the platform, it makes every member of your team more effective, helping them deliver the experiences your customers deserve.
The Allure and Illusion of Composability
Composable CDPs promise flexibility but bring risks and chaos. Learn how Treasure Data’s enterprise CDP delivers reliable scale, compliance, and stability.